CHALLENGES DURING THE PANDEMIC
The global pandemic has caused unforeseen disturbances within established business models. Most firms now face a myriad of unprecedented challenges, including frequent changes in rules and regulations, volatile economic conditions, rapid shifts in customer behavior, decreasing effectiveness of sales channels, and disruptions in supply chain. Businesses need to realign themselves with emerging market trends, such as rapid growth in omni-channel customer experience and rise of contactless offerings replacing physically-shared services.
New opportunities emerge as the world navigates its way through pandemic-fueled uncertainty. As a result, many incumbents will lose their way, while new players will emerge across industries. As with any business disruption, success is highly correlated with the speed and agility with which decision-makers respond.
Data-driven insights have become an essential compass to navigate these uncharted territories. Even as companies look to optimize costs to hedge against the current downturn, most businesses are ramping up their investments in data infrastructure and analytics.
Analytics solutions designed and calibrated in prior economic environments will not be equally effective in the post-pandemic world.
All three drivers for successful analytics solutions — A) Underlying Data, B) Modeling Techniques, and C) Resources — have been deeply impacted by the pandemic.
Subsequently, businesses face the challenge of large-scale recalibration and redesign of analytical capabilities.

Exhibit 1: Pandemic’s Impact on Analytics Solutions
This paper will take a deeper look at the factors causing disruptions to the typical analytical solution design process and our recommendations for the new normal. It also includes a few examples of how different modeling techniques have become more effective in the new environment.
A) UNDERLYING DATA
Impact of the Pandemic:
1. Unavailability of reliable data: A critical requirement for robust and effective modeling is the availability of trustworthy historical data. Insights from pre-pandemic times will not have the same predictive power within the realm of this unique operating environment. Even data from the early days of the pandemic is not relevant for use in later months of the crisis as the patterns shift globally.
2. Delay in critical information: Macroeconomic indicators are typically the primary drivers for most time-series models including revenue forecasting or budget estimation exercises. Indicators, such as the unemployment rate, inflation rate, GDP growth rate, etc. are reported on a quarterly or annual basis, which is “too late” in the current volatile and shifting environment. This time-lag in the critical inputs can significantly impact the efficacy of the proposed solutions.
3. Inability to draw parallels to previous downturns: Even data from historic stress scenarios is not directly useful, given the novelty and unique nature of the current situation. E.g., frameworks designed on the 2008/09 global financial crisis might have used housing price as a leading indicator of economic health. However, this does not hold true in the current situation. These days, even stock market indices, which are typically considered robust indicators of economic health, are driven largely by investor sentiment than actual business activity.
The Way Forward:
1. Rethinking data transformations: As traditional indicators used in analytics frameworks lose their predictive power, fresh ideas are needed to design new derivations and transformations of existing data to better align models to the external environment. As an example, monthly or quarterly reductions in customer engagement metrics were typically seen as more effective indicators of customer attrition risk compared to weekly rates. Leveraging trends across shorter time-windows increased false positive rates. However, increased volatility and radical changes in customer dynamics in recent months have shifted the balance towards transformations with shorter time-windows. Insights derived from monthly or quarterly results, would be outdated and ineffective for many business activities in today’s world.
2. Alternative data sources: Sources of information that may not have been widely used as indicators in a pre-COVID world, might be more powerful. Data sources that are published more frequently can be used as substitutes to traditional sources. For example, weekly unemployment insurance claims can be used as a proxy for unemployment rate. Other emerging trends in the industry include:
- Increased digital touch in all spheres of customer interactions makes insights derived from digital sources extremely valuable. For instance, product engagement data from mobile and web-based applications are being used to derive actionable marketing intelligence such as personalized offers, and product feature enhancements. Social media data is used to rethink brand positioning and measure customer satisfaction / NPS.
- As the severity of the pandemic shifts across the globe thereby adjusting people’s habits, data-scientists have begun to look for innovative proxies for business activities by region. E.g.: Google’s mobility reports, OpenTable reservation data, etc. have been leveraged by firms as indicators of economic activity in different regions.
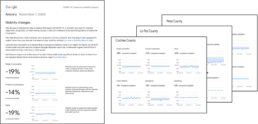
Exhibit 2: Sample Google Community Mobility Report
The reports contain percentage drop in visitor counts across different public places by county (from baseline)
3. Leveraging newly-built data solutions: Many technology companies have created data mining solutions and released them to the general public as goodwill. These databases are updated daily and can be seamlessly integrated with all standard analytics tools.
Examples include:
- Tableau, a product owned by Salesforce, is providing free data resources and training to quickly integrate data from WHO / CDC.
- White House Office of Science and Technology Policy (OSTP), has partnered with technology firms, including Microsoft, to create a COVID-19 impact data repository.
- Power of the crowd has enabled the development of open-source data libraries for COVID-19 within standard analytical tools like R, Python, etc.

Exhibit 3: Example of leveraging public data libraries with real time COVID statistics
A wealth of real-time market information has been made available for public use and can provide valuable business insights
B) MODELING TECHNIQUES
Impact of the Pandemic:
1. Limitations of current analytical solutions: The majority of analytical solutions in existence were customized to provide superior business intelligence in normal economic operating conditions. However, these solutions were not designed for the kind of black swan event currently reshaping the economy. A large-scale model revalidation and recalibration operation is underway across most data-science teams. As an example, in order to capture the effects of minor changes in macro trends (e.g., annual growth in GDP / population / interest rates etc.), power or exponential functions were often applied to magnify the effects. Drastic shifts in the economy, as often witnessed during the pandemic, make the insights derived from these solutions counterintuitive.
2. Rising complexity of algorithms: A rapid increase in computing power and increasing accessibility to clean, structured data has driven analytics professionals to deploy elaborate statistical techniques to power most business decisions. Today’s models are bespoke and leverage vast amounts of historical data and multiple mathematical concepts to drive superior performance. Due to the complexity and intricate interlinkages of multiple algorithms, recalibrating these behemoth models takes considerable time and effort.
As an example, highly sophisticated algorithms form the core competency for many trading firms to generate revenue out of regular market movements. In April 2020, when the price of oil futures dropped below zero, many of their quantitative trading models stopped working, as they were not designed to operate in such conditions. Consequently, many firms booked heavy losses and spent considerable time and effort re-calibrating and rebuilding the wiring of their complex models.
The Way Forward
1. Speed & agility: Even a perfect model, with comprehensive sensitivity and scenario analysis, will not yield sustained stable performance in such a volatile environment. Constant monitoring of the model health, frequent recalibrations and inclusion of new data sources would be a common theme in the days to come. Marrying new data with historical models requires more specialized methodologies (e.g., overlays), compared to standard use of historical data. Customized solutions, combining multiple mathematical theories, typically take more time and effort to recalibrate. The focus for business analytics teams should shift towards quick, iterative, and easily-deployable solutions that can be quickly realigned with the changes to the external climate.
2. Leveraging open-source solutions: An easy way to optimize the time and effort requited to build analytics solutions, is to rely on open-source AI / machine learning algorithms. These algorithms are available for modifications and improvements to the public and are continuously optimized for performance. Thus, they provide businesses with cutting-edge methodologies at almost no cost. Most of these algorithms have proven success across multiple functions and industries, and more importantly, can be calibrated and redesigned very quickly to keep up with exogenous changes in business conditions.
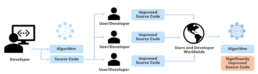
Exhibit 4: Open-source operating process
3. Using the Right Tool: Artificial Intelligence and Machine Learning power everyday business decision-making and provide competitive advantages in today’s business landscape. A plethora of open-source algorithms are available to data scientists today, and fitting algorithms to datasets has become simpler than ever before. The missing link in successful delivery of most analytic solutions is the ability to choose the most appropriate algorithm and statistical concept for each cause.
In today’s uncertain times, increased volatility and disruption to standard operating environments have made this task even more complex.
Many examples can be drawn upon to illustrate how the pandemic has perturbed the standard model development process and how different techniques have become more relevant.
A. Dynamic Customer Segmentation
Portfolio segmentation is a precursor to every analytical exercise, with an established process of combining business experience and standard statistical techniques. Typically, data scientists try to fit different algorithms and calibrate models with new data through a static segmentation, however, a more agile approach to segmentation is needed for an effective analytics framework under the current circumstances.
The intensity of COVID-19 varies by industry and geography, as different regulations are imposed. Moreover, customers are changing their behaviors more frequently now than ever before. Unsupervised machine learning algorithms, such as K-Means, Apriori and DBSCAN, provide quick clustering insights and have become an integral part to any learning or prediction engine. Many businesses are also trying to shift towards neural-networks-based solutions on account of their distinctive superiority in targeting prospects within a large database.
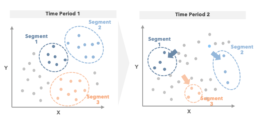
Exhibit 5: Illustration of how a customer population should be dynamically segmented, as trends change over time
B. Consideration of a Larger Set of Predictors
Past successes and years of business experience have typically provided model developers with a handful of predictive variables to start with. In many cases, dimension reduction exercises did not make a significant difference and were often ignored.
The uncertainty fueled by the pandemic is now forcing data scientists to come up with new data sources and innovative transformations. Prior experience is less effective, and a wider list of predictive variables is needed at the start to capture indicators with highest predictive power in the current environment. Thus, many statistical techniques for dimension reduction like LDA (Linear Discriminant Analysis) or PCA (Principal Component Analysis) can be used to derive optimized and powerful predictor lists from large consideration sets.
As an example, in prioritizing customers for a relationship-check campaign, in addition to the standard variables used (such as spends, customer value, contract status, etc.), digital engagement and social media behavior metrics need to be included in the current environment. Different transformations can then be derived from these new inputs, as model developers test and learn the respective predictive powers. This process would significantly increase the number of variables under consideration, potentially making the models bulky. An initial dimension reduction exercise can speed up both the initial model development process, as well as future recalibration efforts.
C. Increased Complexity and Inter-dependency of Variables
Macroeconomic indicators form a key component of all revenue forecasting, capital buffer computations, and regulatory modelling exercises. As with any economic disruption, macro-indicators like unemployment rate and housing price index show much stronger correlation than usual.
A fundamental reason for the failure of the valuation models of MBS (Mortgage-Backed Securities) and CDS (Credit Default Swaps) in the 2008-09 crisis was the incorrect assumption of risk factor independence. The theory holds in normal economic circumstances, but risk factors show strong inter-dependency in times of crisis.
Independence of predictor variables is a fundamental assumption in any regression-based model. This includes widely-used times-series modeling techniques such as ARIMA. Many of these frameworks suffer from multi-collinearity issues during turbulent economic times. Decision tree models, including CART, random forests, XGBoost / Cat Boost, etc. are more effective in economic downturns, as they capture non-linear, complex relationships in data and do not suffer from multi-collinearity issues.
As businesses look to stay ahead of the curve through analytical superiority, applying the most appropriate framework for specific problems will be the key to differentiated success. Notably, stewardship from experienced analytical professionals, in tandem with innovative thinking, will allow for design of powerful frameworks, tailor-made for today’s environment with quick turnaround times.
C) RESOURCES
Impact of the Pandemic:
1. Increased difficulty of designing new solutions: The process of establishing an end-to-end analytics solution in production often takes quarters to years. Given the current uncertainty and limited availability of relevant historical data, these timelines have been stretched further. At the same time, business leaders require more frequent and high-precision intelligence to thrive in the current dynamic environment. Most data science teams are not trained to design and develop models with the agility demanded by the current dynamic situation.
2. Pressure to recalibrate existing models: In addition to the regular pipeline of work, data science teams are now facing the additional workload of off-cycle recalibration of multiple existing models. The increased volatility in the economic climate also calls for multiple updates to financial forecasts and increased frequency of model monitoring. Furthermore, the demand for economic analysis and reports on business performance has increased significantly amongst leadership due to the constant swings in customer behavior. Thus, everyday life for analytics professionals now consists of a plethora of requests, coming from different parts of the organization with shorter turnaround times.
3. Work-from-home constraints: Data privacy and security concerns have forced data-science teams to work as closely knit units behind closed doors. Remote working breaks down customary team workflows, forcing people to spend more time in meetings for collaboration, thereby reducing available time for individual tasks. In addition, data scientists need enhanced computing power and superior internet connectivity to extract data, work through firewalls, and access shared software and platforms with limited IT support.
The Way Forward:
1. Aligning analytics with business priorities: Many businesses stood up rapid-response analytics teams to address the overnight impact of COVID-19 and redesign data-driven solutions for the future. However, lack of understanding of the business priorities and ineffective communication of the critical issues led to the design of multiple redundant solutions. As business leaders continuously refresh their strategy to steer the firm through the pandemic, effective communication channels must be established within analytics functions to ensure alignment with the broader strategy.
2. Tighter cross-functional collaboration: It is not uncommon for data science teams to build analytics solutions and then socialize with business partners for implementation. This operating model creates a time-lag for the solution to reflect the rapidly changing business environment. The ‘on-the-ground’ teams such as sales, marketing, service, etc. typically have a real-time and realistic view of the market conditions. Hence, now more than ever, business leaders and data scientists need to partner earlier and more closely for the analytics engine to reflect on-the-ground reality.

Exhibit 6: Recommended Cross-Functional Analytics Design
3. Breaking siloes within data-science functions: In the industry, virtual barriers separate different analytical functions to ensure independence across processes. As the pandemic has introduced multiple common requirements across teams, such as data gathering and baseline setup, the existence of functional siloes creates considerable duplication of efforts. Common portals across functions for sharing non-sensitive yet critical information, can maximize efficiency of analytics resources at an enterprise level.
4. Centralized model management: Not all analytical solutions deployed within a business are equally impacted by the pandemic. The traditional hierarchy of model criticality has been upended and will keep changing based on external circumstances. Inefficiency is created if individual teams have the responsibility of monitoring the performance of the respective models at short intervals. It is therefore advisable to assemble a cross-functional crisis-response team in order to monitor the health of the entire suite of models and flag concerns to the respective teams as needed. This allows data scientists to focus on their core competence and increase overall efficiency.
IN CLOSING…
The COVID-19 pandemic and subsequent lockdowns have led to a drastic increase in overall uncertainty for businesses. As with any disruption, ability to adapt to changing environments will dictate which businesses lose market share, and which will thrive in the years to come. Analytics solutions form a core part of business intelligence in the 21st century and will play a key role in the global economic recovery. For these solutions to achieve their full potential, a concerted effort is needed to realign them to today’s market forces and increased volatility.
As firms strive to update their analytics engines and solutions to respond to the new business environment, large-scale redesigns and recalibrations are needed. In this unprecedented and unknown territory, speed and agility have become paramount, more so than ever before. A well-coordinated and synchronized approach is needed to be successful in this effort, and involvement of business leadership in the process is critical. Partnerships with technology players, cloud computing providers, and business consultants will play a critical role, as they bring in valuable expertise in redesigning and structuring the most appropriate analytical solutions for a business. This holistic approach towards analytics will enable businesses to successfully navigate uncharted territories of the “new normal”.
Read More

From Interface to Intelligence
The next frontier of digital commerce is not better checkout, but better coordination. This whitepaper examines how agentic AI is transforming fragmented transactions into intelligent, autonomous experiences - and what businesses must do to stay ahead.


Banking on You – Personalization in Financial Services
Capturing and sustaining attention is key to building customer loyalty, driving sales, and standing out in a competitive landscape. In this attention economy, what really helps business maintain relevance is to personalize the interactions for their needs, context and preferences.

The Open Book on Compliance – US Open Banking Regulations Decoded
The CFPB’s new Open Banking regulations will impact how financial service providers can access and monetize consumer data, while also influencing future practices around security, consent, and data sharing.

Mixed Reality
As these technologies become more accessible to the wider public, AR and VR are expected to grow into a $125 billion market by 2025.

Money Games
The use of gamification has proliferated across all industries, with retail, entertainment and education leading the charge. Apps like Duo Lingo, Kahoot, Fitbit, Starbucks etc., are all some of the most prevalent examples.

Monetizing Data Analytics
For several years, it has been said that “data is the new oil” and arguably, the most valuable strategic asset for a business. Whilst getting value out of data might be less straight-forward, it is true that data needs to be refined to make it valuable.

From Cards to Chains – Payments in the Blockchain Era
To remain competitive in the evolving financial landscape, card networks are uniquely positioned to bridge this gap between traditional payments and new blockchain networks as transaction facilitators, leveraging their global reach to make transactions on their networks quicker, cheaper, and more secure.

A Borderless World
Significant shifts are underway in the cross-border payments sector, across the demand-side and supply-side. Consumer expectations from domestic payments (instant, fully traceable, risk-free, etc.) are being applied to the more complex cross-border space. Businesses that capitalize on these shifts stand to shape the future of the industry.

Cracking the FedNow Code
Real-time payments are increasingly recognized as a critical component of modern financial systems, offering speed and convenience in an interconnected digital world. As we venture into the future, the recent launch of the Federal Reserve's instant payment service, FedNow, stands at the forefront of a payment revolution in the US.

Future-Proofing Healthcare Delivery
The right telehealth platform is critical to meeting patient expectations and providing the best possible provider, patient and administrator experience. Today patients are demanding more control over their healthcare and want to access care from anywhere.

The GenZ Wave
Gen Z is not merely a younger version of millennials; they are poised to disrupt all aspects of the economy. Companies must therefore adapt in time to cater to the preferences and expectations.

Gaming and Financial Services
As younger generations start to play for competition and skill development, there is a rise in payment flows, volumes, and subsequent opportunities arising out of the same. Financial institutions are not only presented with the opportunity to monetize on gamers but also target younger Gen Z and Millennial consumers to upsell and cross-sell their existing products.

Maximizing Value from Value Added Resellers
The role of Value Added Resellers (VARs) is transforming from basic reselling to strategic technology partnerships that offer comprehensive IT solutions. To maximize the value of these evolving relationships, firms must bring transparency to pricing, agreements, and the scope of work.

Latent Growth in LatAm Credit Cards
The payments industry has been experiencing explosive growth across Latin America over the past few years: cash usage has decreased ~20% as consumers pivoted towards payment products that are well integrated into the financial ecosystem.

Navigating the Buy Now Pay Later Era
The rising aspirations of consumers combined with the limited access to, and opaque nature of traditional financing solutions, has given rise to innovative products for underserved segments. BNPL is one such solution that offers short-term financing to users with the ability to pay in definite installments with low to no interest rates.

Modernizing B2B Client Delivery
Leading B2B firms are very well aware that their client delivery experience needs to have the same levels of service, responsiveness, transactional ease as any digital consumer experience. Majority (72%) of B2B buyers expect a similar experience on a B2B site as they get on a consumer website (1).

Winning in Mature Markets
Competition is an important facet of business world, and the process of seeking growth is a continuous one. One should never stop trying to win new customers or retain existing ones. After all, competitors are always trying to win your customers over, especially in mature markets.

Putting Customers At The Core of Your Business
Digital Transformation is about developing new capabilities and leveraging new channels to design and deliver a better client experience.

Realizing the Reality of Real Time Payments
Real time payment (RTP) transactions are likely to exceed 300B by 2023, growing at 40% per year worldwide. Financial Institutions need to quickly find their own space in this ecosystem. They must redefine their value proposition and rethink their business models around this phenomenon.

Client Loyalty 2.0
We are on the cusp of a revolution within financial services that will have far-reaching ramifications for the +1 billion unbanked, current models of financial intermediation across entities and borders, and ultimately the very nature of how end-consumers understand financial health. As this understanding held by customers evolves, so too must the operations, services, and visions of providers.

The Tale of Two Countries – Insurance
The pandemic has created unprecedented challenges for the insurance industry. Experiences of the world’s biggest economies (U.S. & China) offer valuable lessons as to where the industry can improve and change in order to better handle similar events in future and build sustainable risk management systems.

Path to Innovation
Innovation has been in vogue for over a decade but the need to be innovative has never been felt as strongly as today. As businesses are learning to thrive under the lasting effects of the pandemic, they need to reinvent products, services and customer experiences to satiate emerging patterns of demand. To truly capitalize on the opportunity, business leaders need to look beyond internal capabilities and embrace a networked model of innovation to drive positive impact.

Reimagining Marketing
The COVID-19 pandemic has re-shaped the landscape for marketers. They are not only forced to cut budgets to save costs, but also face the challenge of keeping up with new emerging customer behaviors. These unprecedented changes call for a broader shift in marketing tactics and investments to successfully navigate the current transformed landscape.

Age of Contactless Mobility
Cities are at a standstill, but they are bound to get moving again. Urban mobility will never be the same, and contactless payments will shape the new normal. Trends are shifting, preferences are being broken, and opportunities abound!

The Path to Decentralized Finance
We are on the cusp of a revolution within financial services that will have far-reaching ramifications for the +1 billion unbanked, current models of financial intermediation across entities and borders, and ultimately the very nature of how end-consumers understand financial health. As this understanding held by customers evolves, so too must the operations, services, and visions of providers.

An Agile Approach to Digitalizing Wholesale Banking
Credit has seen its fair share of ups and downs, from being the crux of financial services, to commoditization and mass distribution, to now being re-engineered. In the realm of Wholesale Credit, a revolution is underway.

Driving Productivity Through Systems Selection
Procurement often involves multiple disparate stakeholders, systems and protocol. This complexity results in increased reliance on inefficient sourcing processes and only partially takes advantage of all the benefits available from supplier competition.

Putting IT Infra Consumers on a Diet
One question seldom asked is “how do I put my (IT infrastructure) customers on a diet?” The demand side is often assumed as a given, and there is with little assessment of (over-) consumption by applications.

Smart Blockchain Contracts: Are We Finally Going Paperless?
Smart contacts offer the potential to facilitate or fully automate processes that are heavily paper-based today, particularly long-winded, expensive legal processes.

The Unbundling of Retail Banking
Not unlike a piece of software, retail banking can be portrayed as a stack comprised of 3 layers, where the complexity of each services can be abstracted into discrete segments and end products.

Binge-Worthy Digital Advice
While the trajectory of ‘digitization’ in financial services is encouraging, there is still significant demand from customers to expand and evolve their digital experience.